Hannah Yan Han
Hello! Glad to see you here. This is a collection of my personal projects made during free time.
- All Categories
- Data Visualization
- Creative Coding
- Data Science
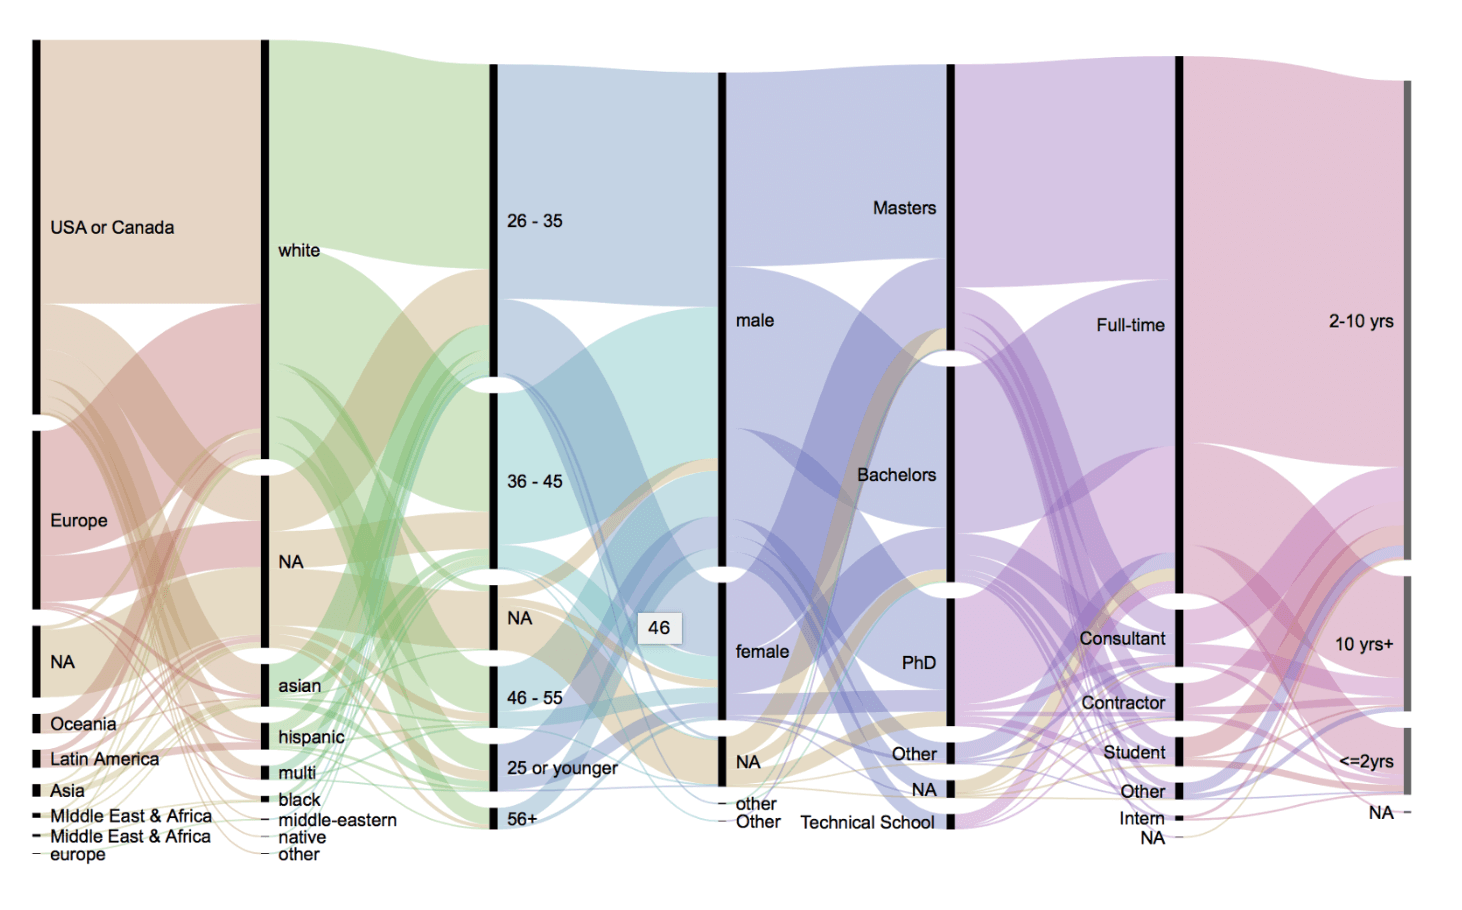
The State of Data Visualization
(Made in R, 2017)
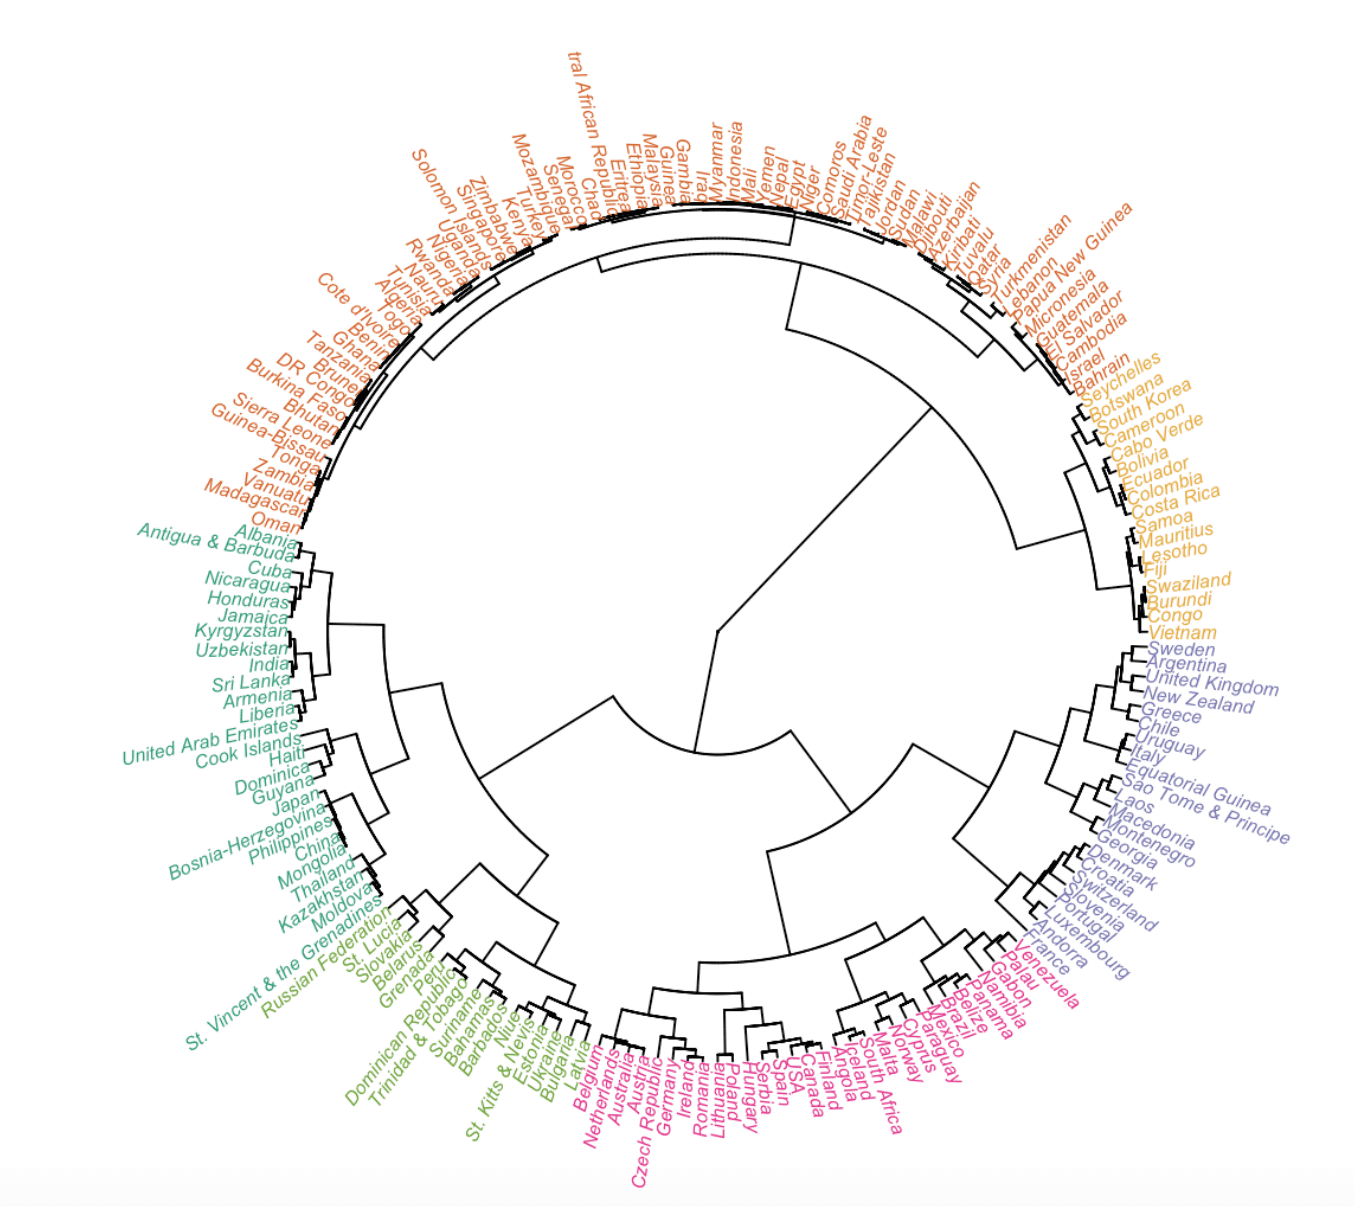
Countries by Drinking Habits
(Made in R, 2017)
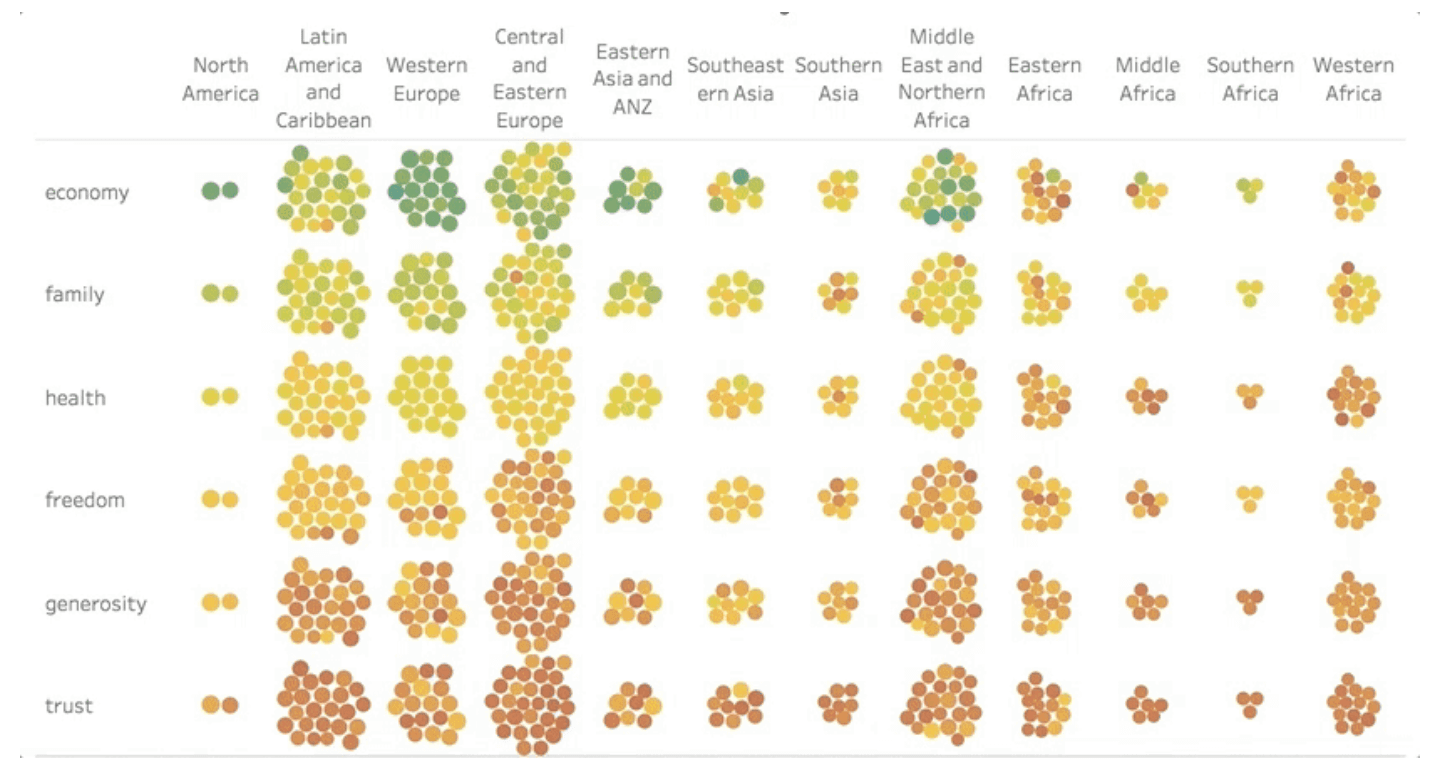
Happiness by Regions
(Made in Tableau, 2017)
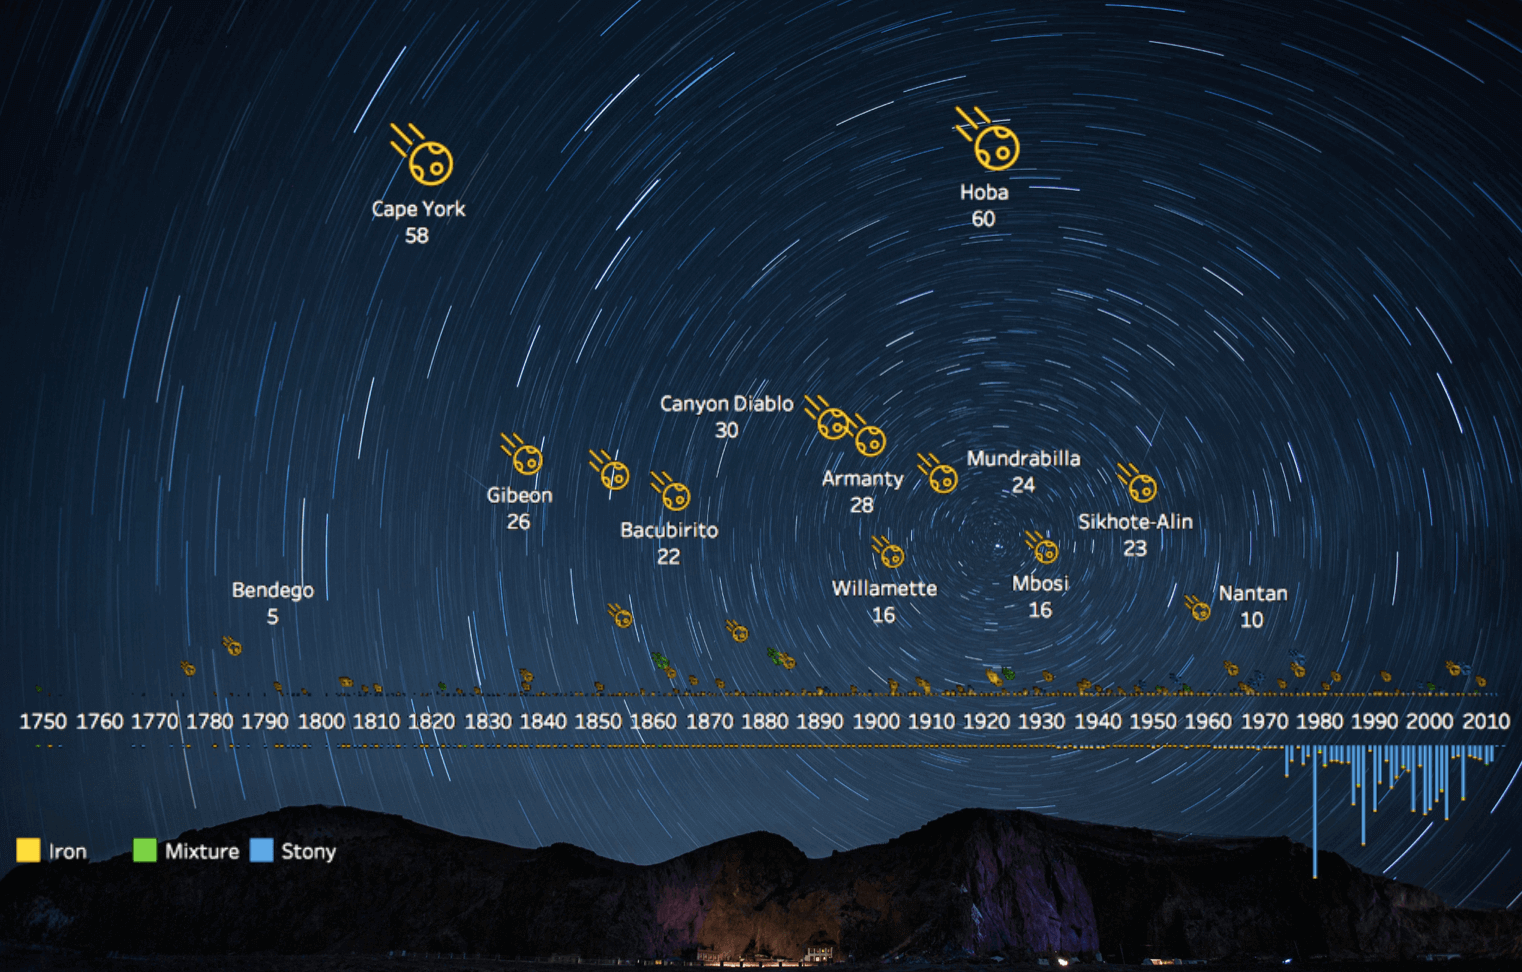
Getting to Know the Meterorites
(Made in Tableau, 2017)
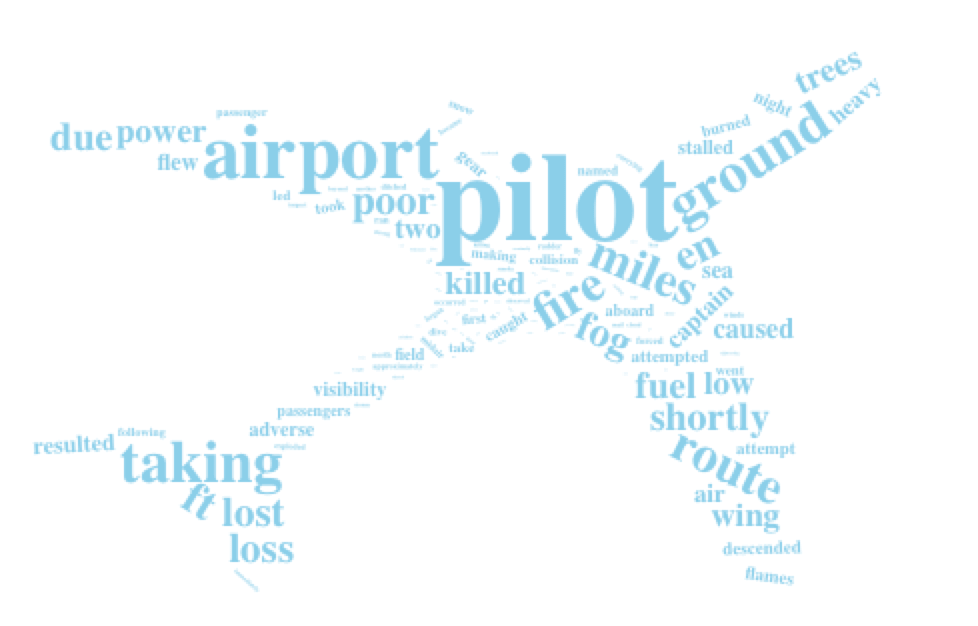
When Flying Gets Dangerous
(Made in R, 2017)
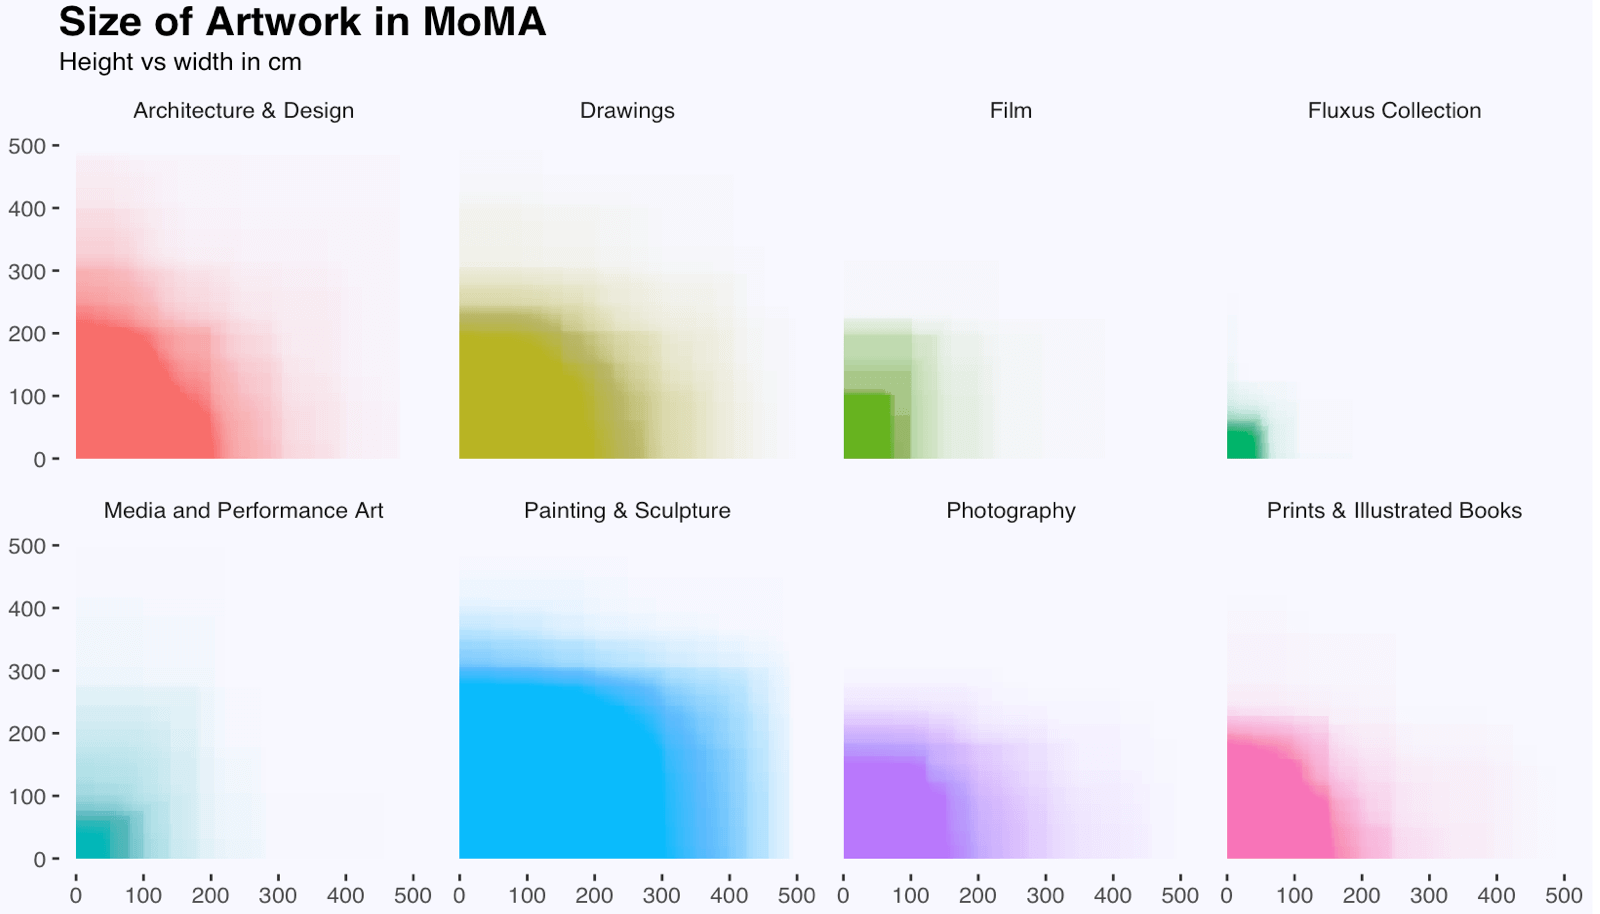
MOMA and its Artworks in Data
(Made in R, 2017)
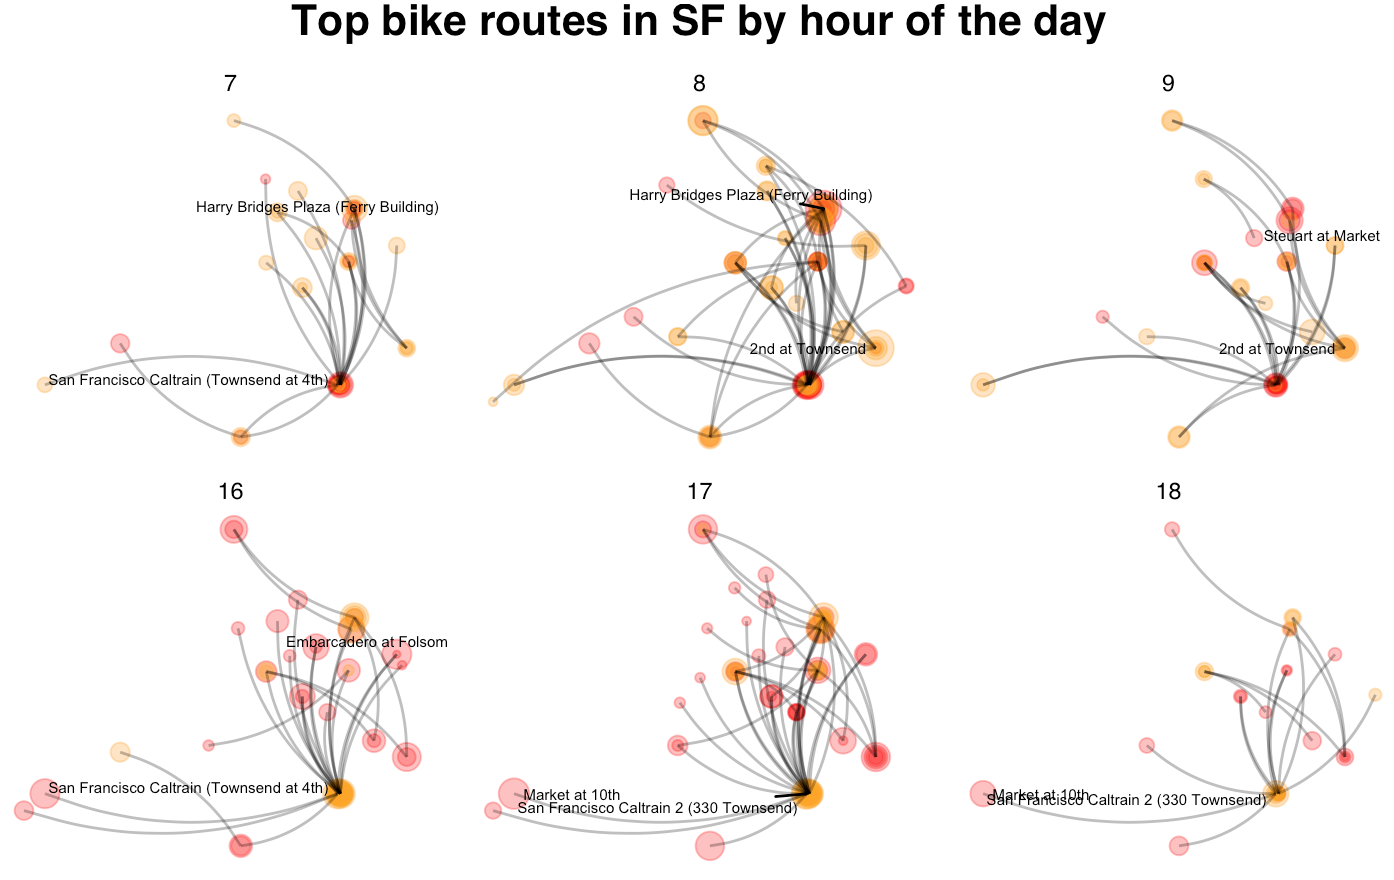
SF Bike Traffic
(Made in R, 2017)
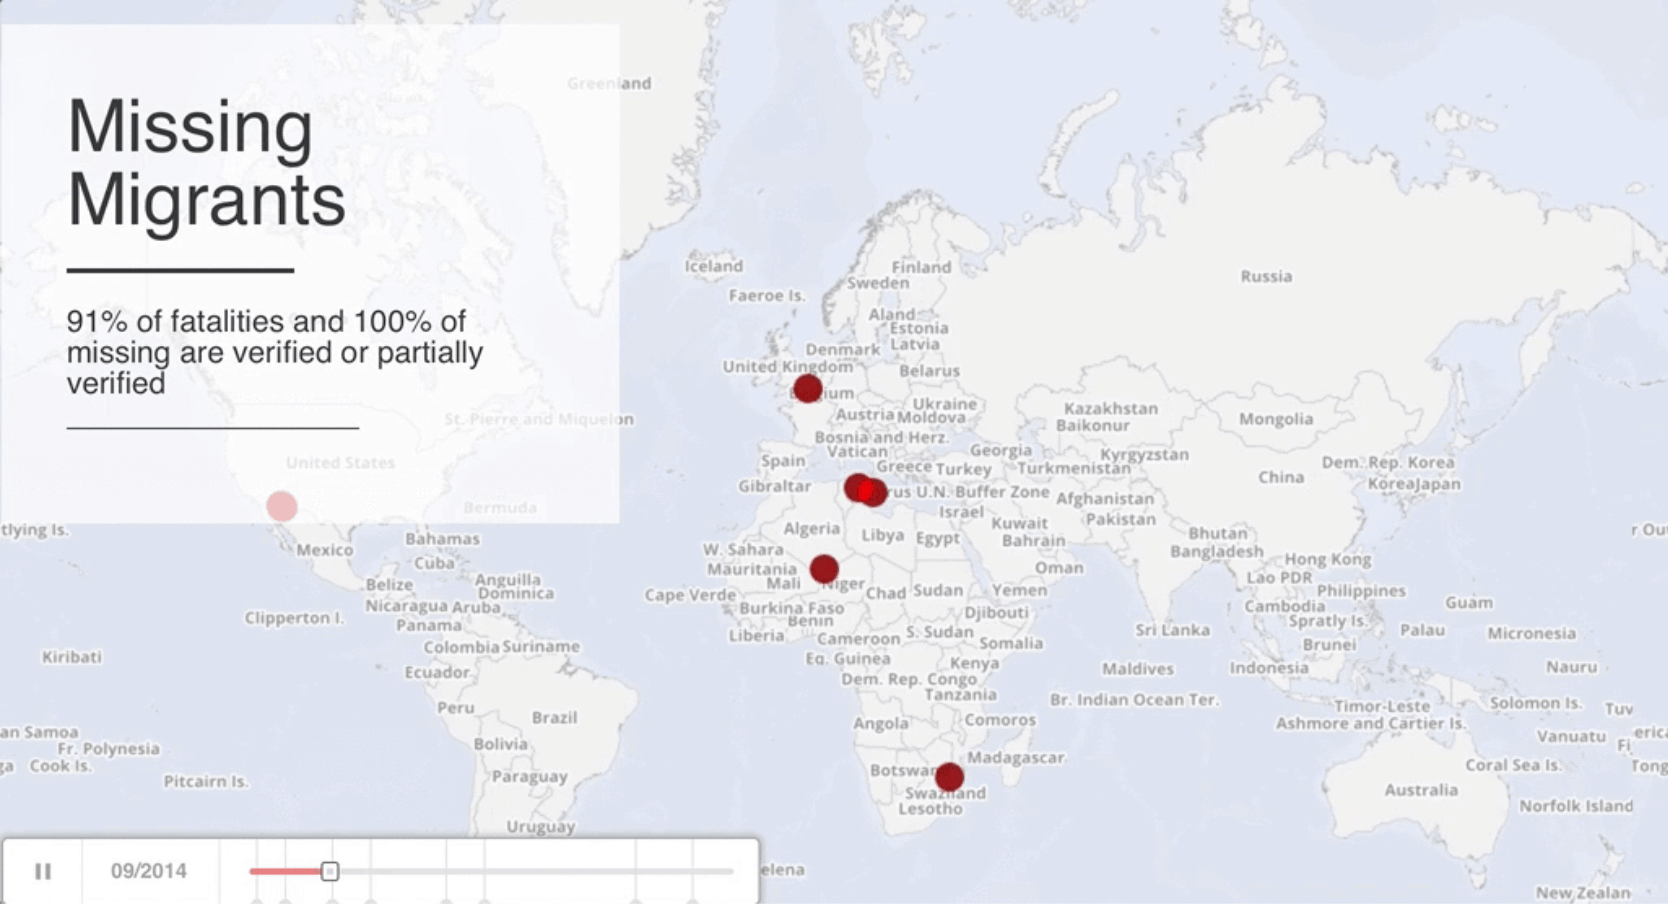
What happened to the missing migrants and who are they
(Made in Carto & Odyssey.js, 2017)
Judge a NYT Bestseller by its Cover
(Made in R, 2017)
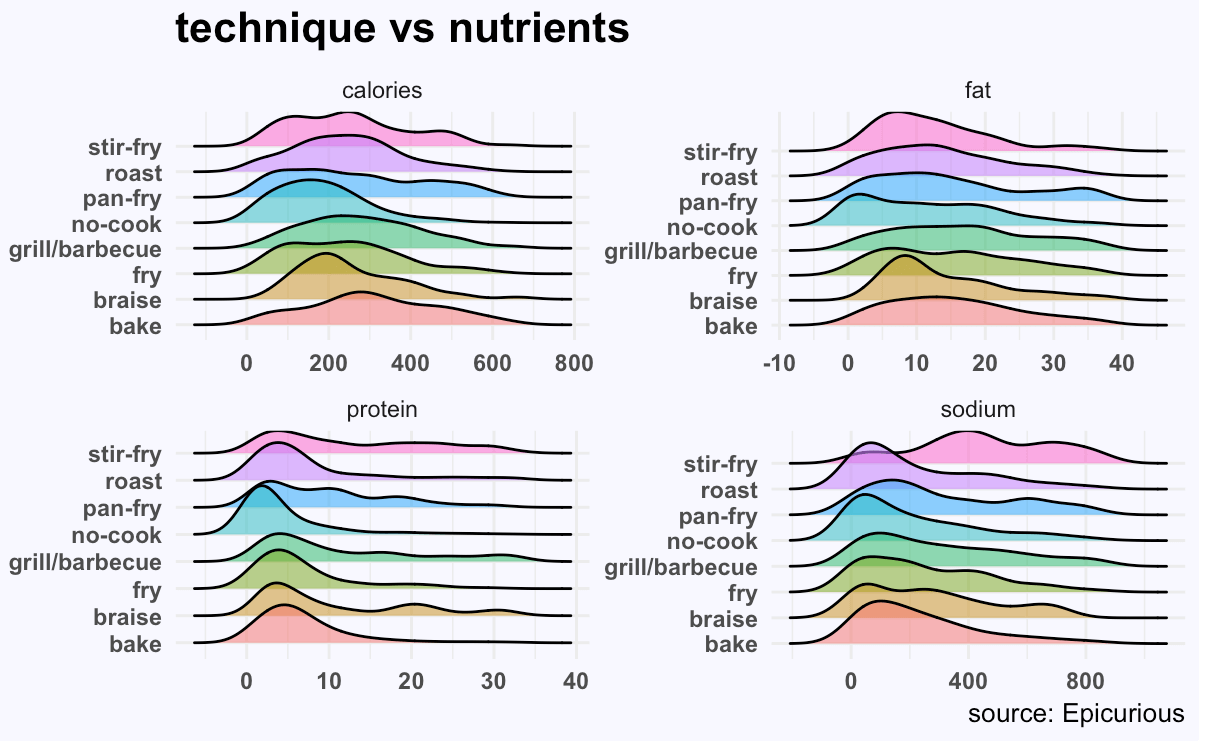
How healthy is the meal: an analysis of recipe data
(Made in R, 2017)
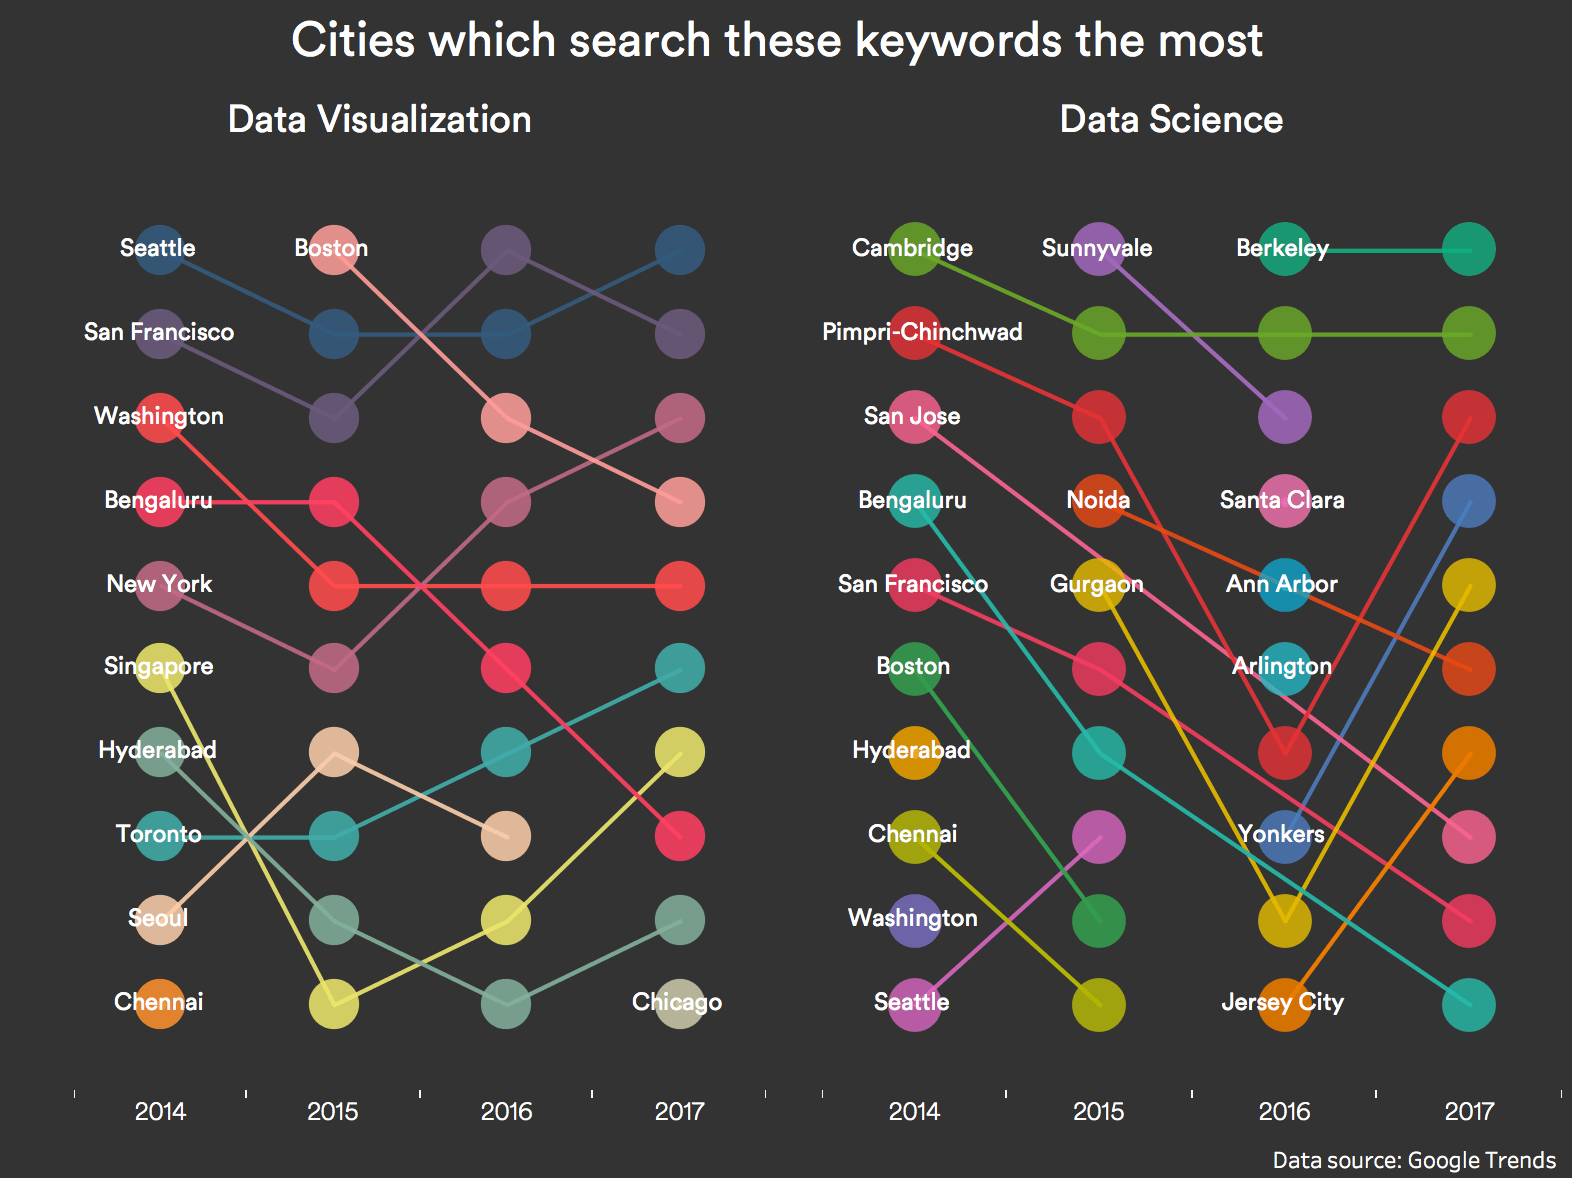
Where People Are Most Interested in Data Science and Data Viz According to Google Trends
(Made in Tableau, 2017)
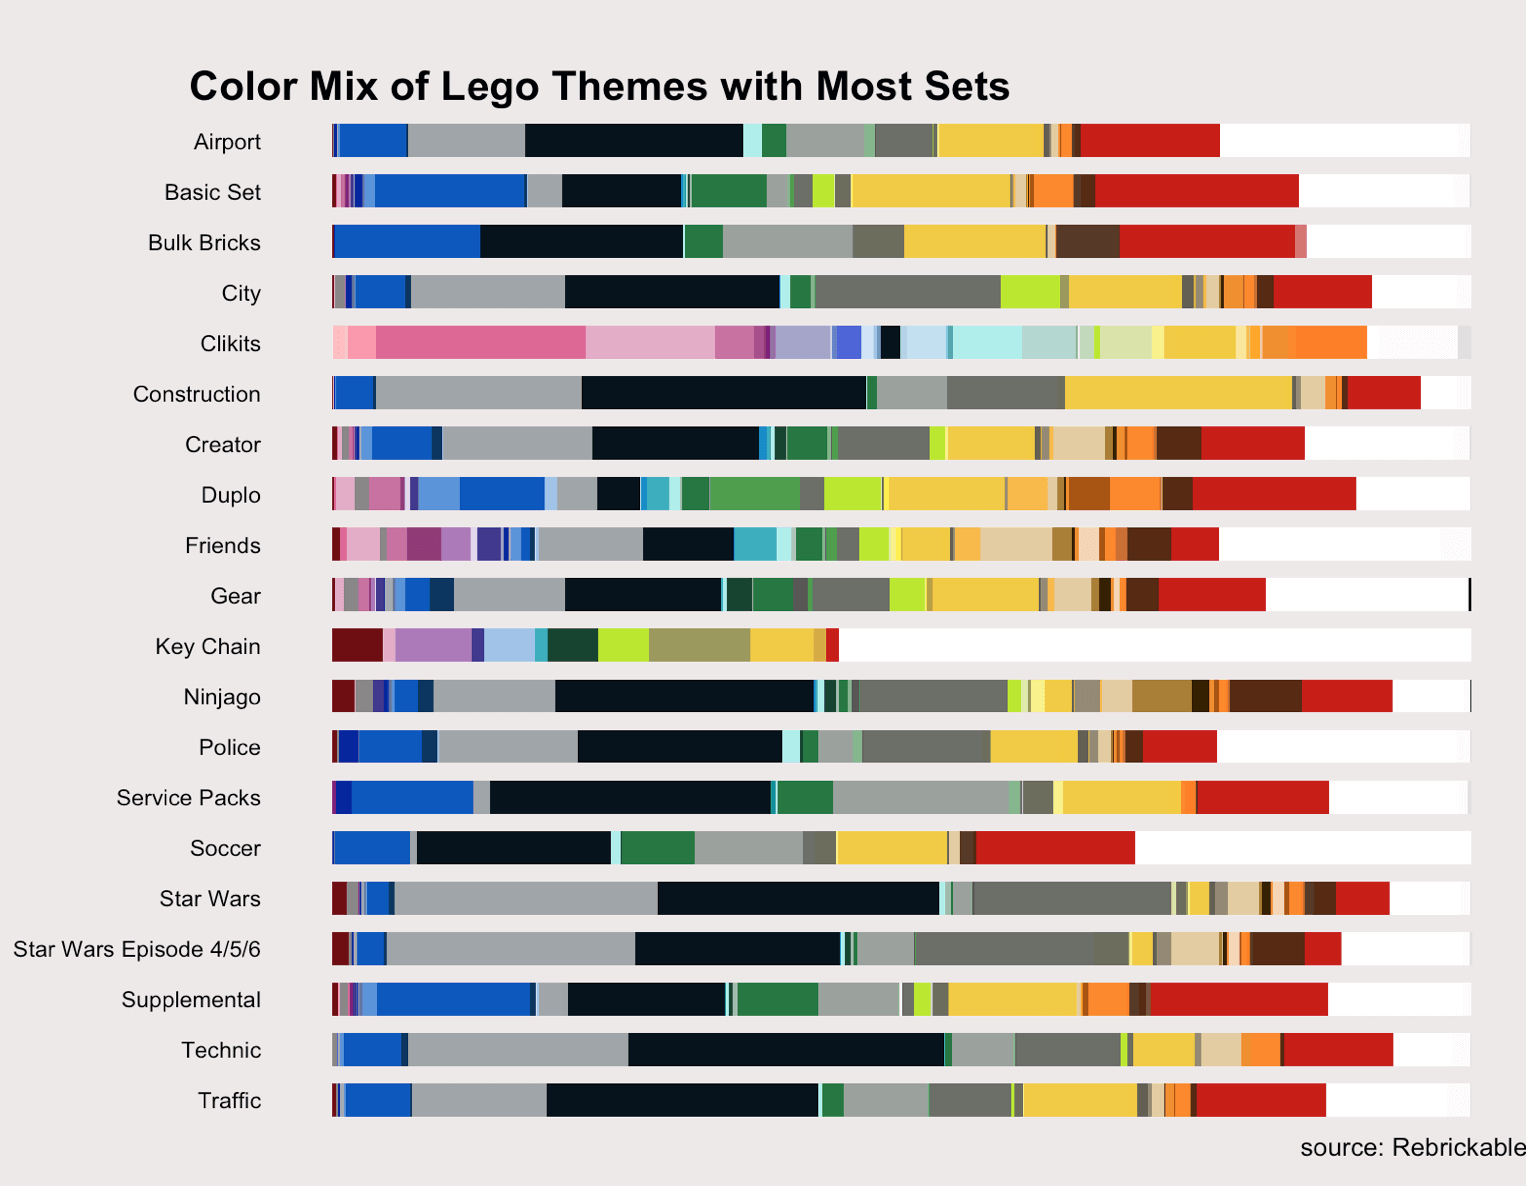
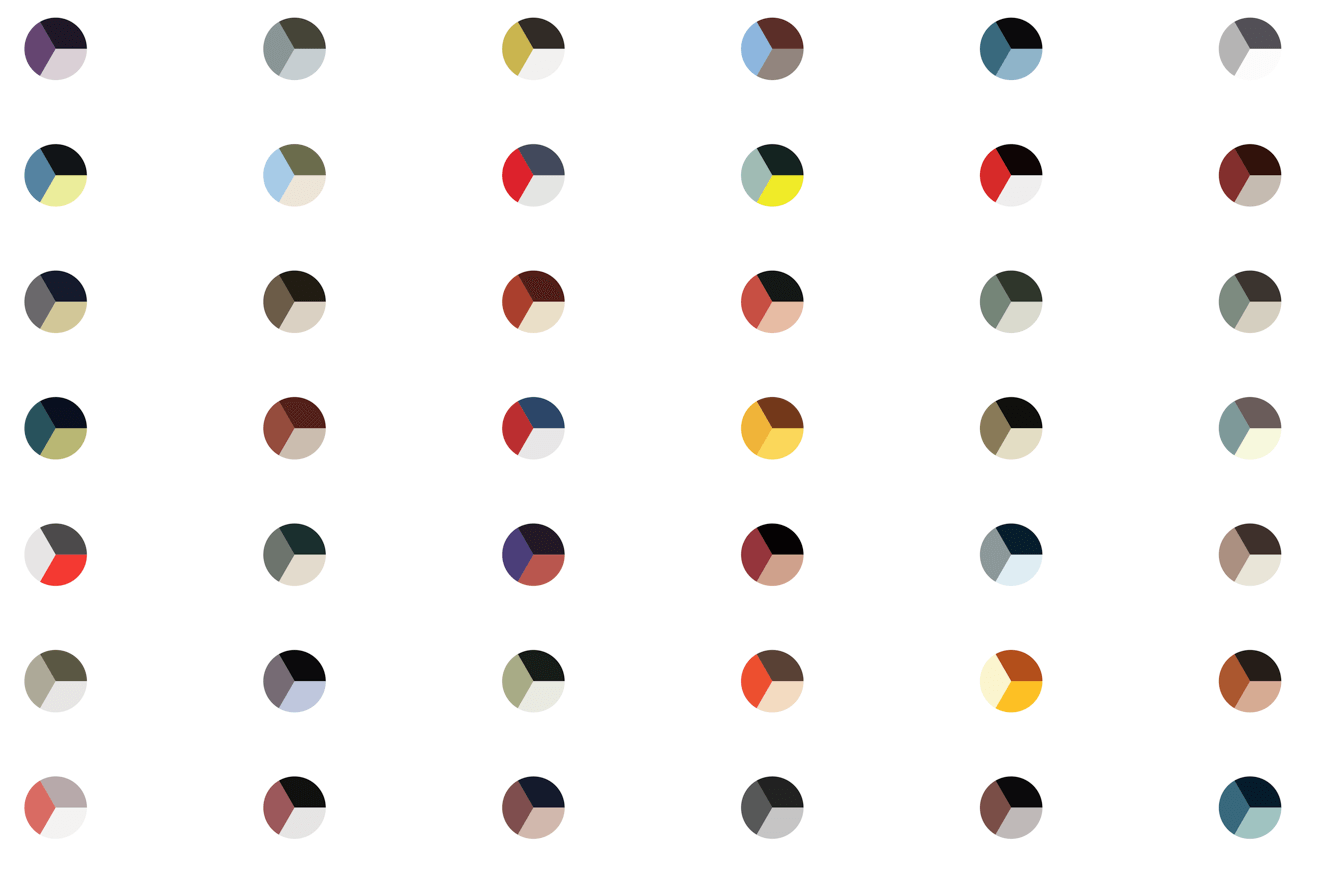
The Color History of Lego
(Made in R, 2017)
The Hyphenated Occupation of TED Speakers
(Made in R, 2017)
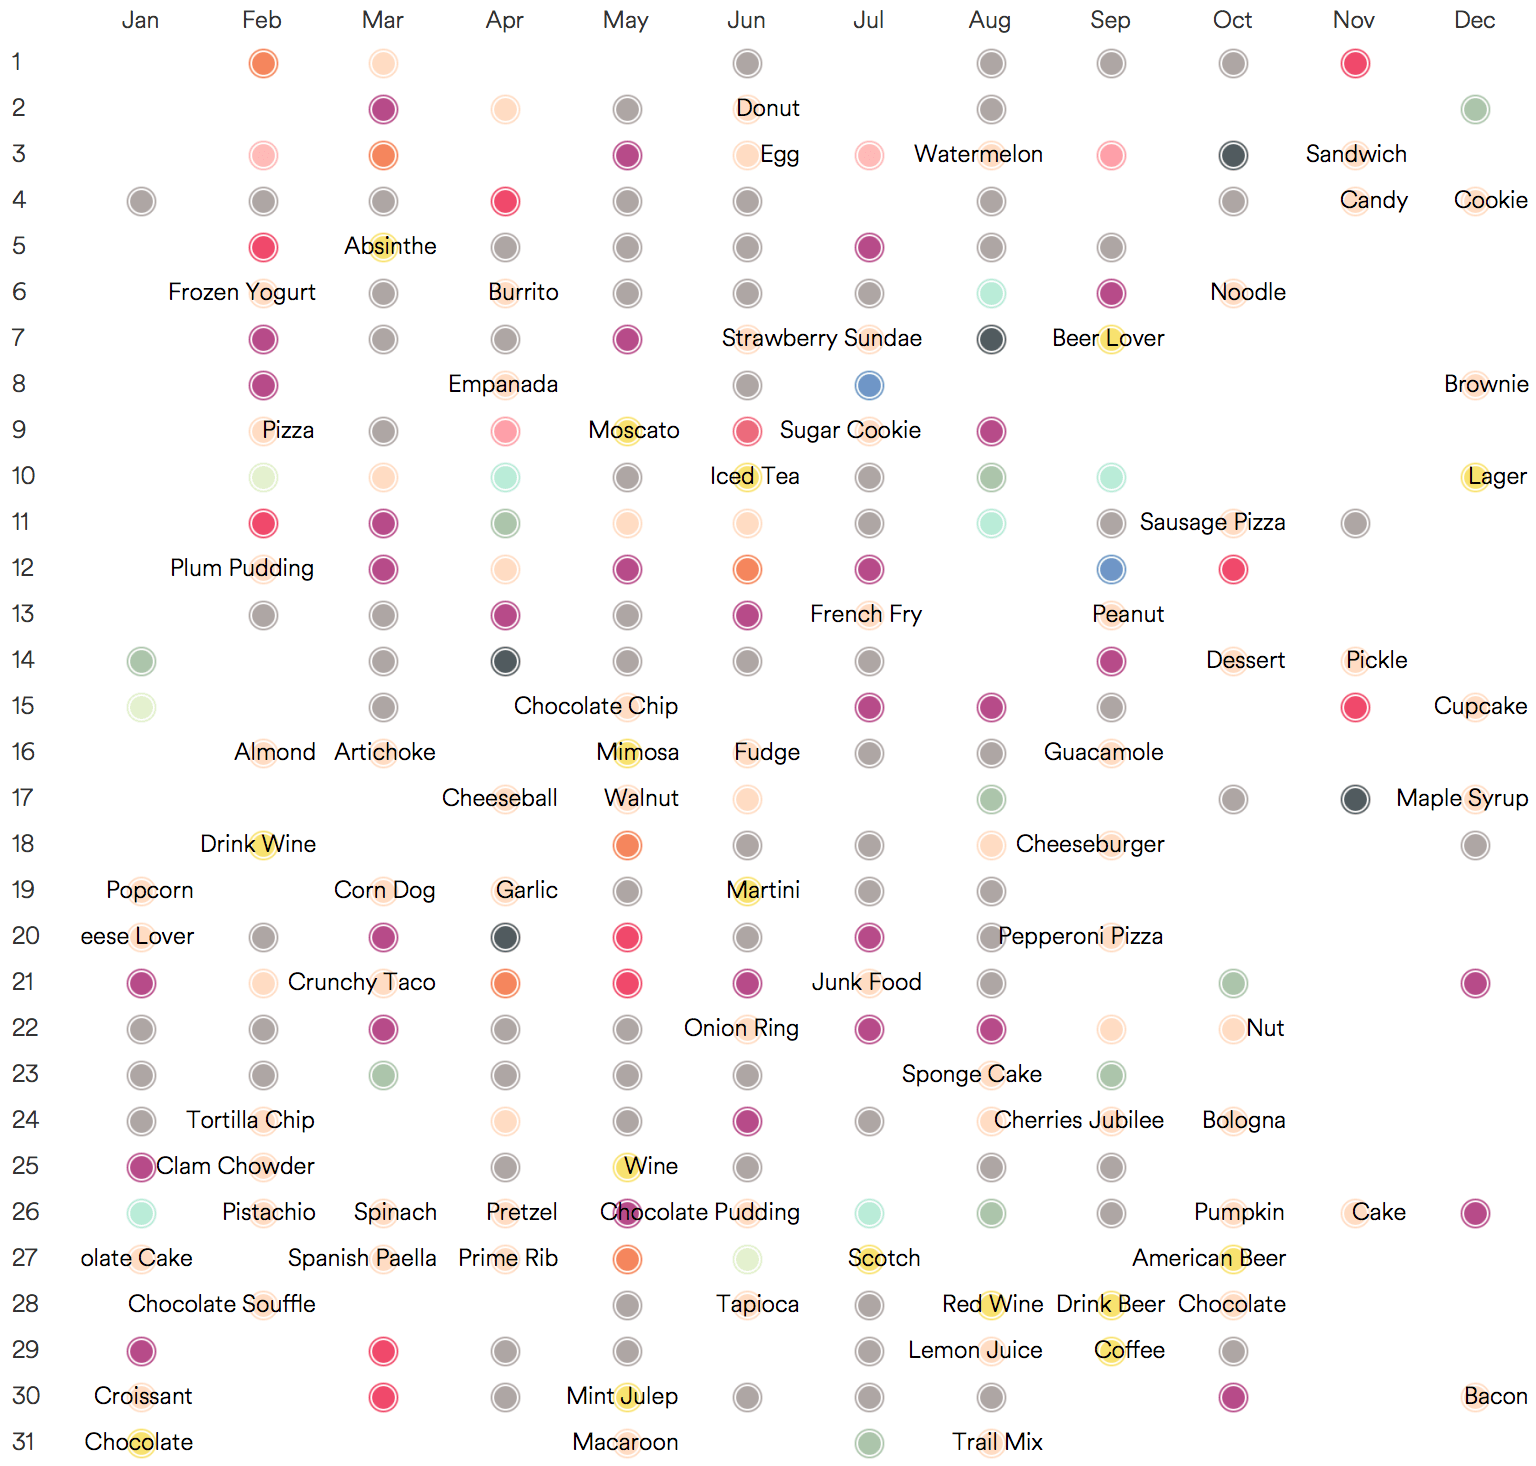
The Complete Guide to Superfluous Holidays
(Made in Tableau, 2017)
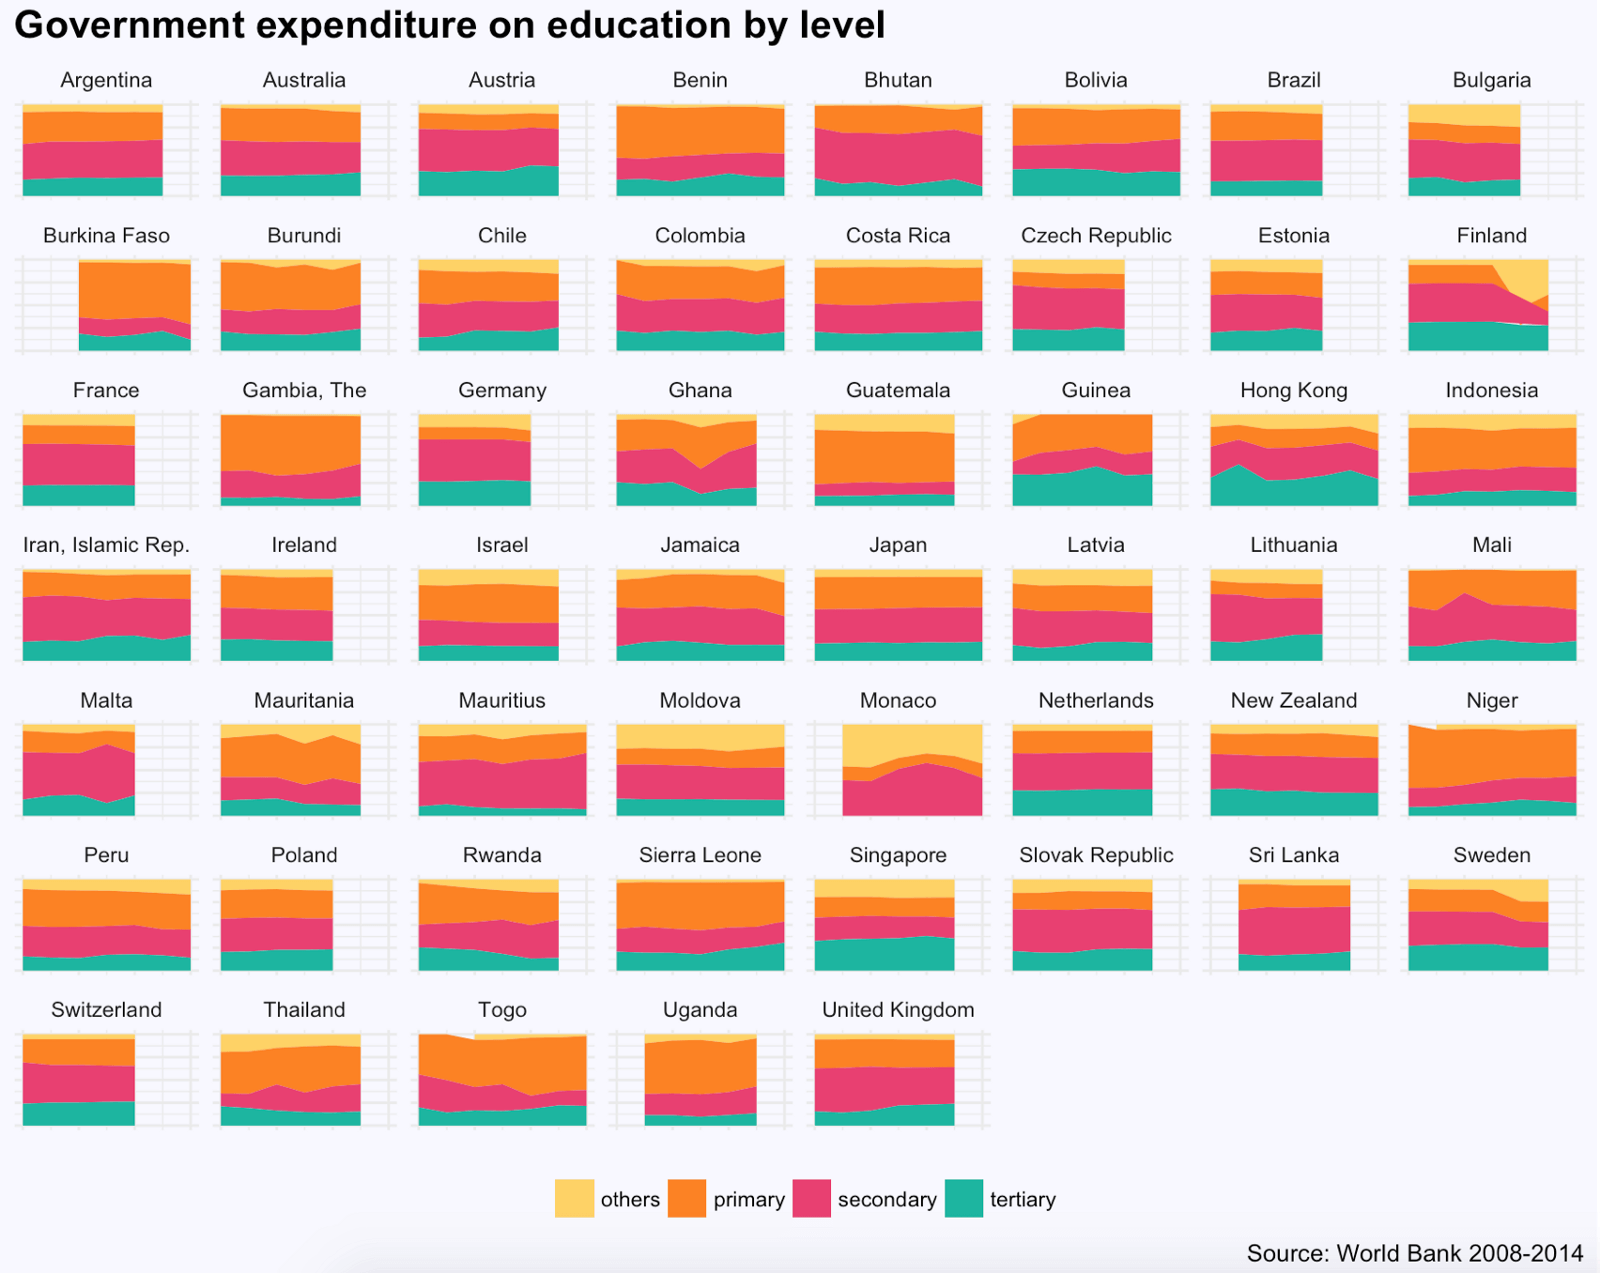
World Education Expenditure
(Made in R, 2017)
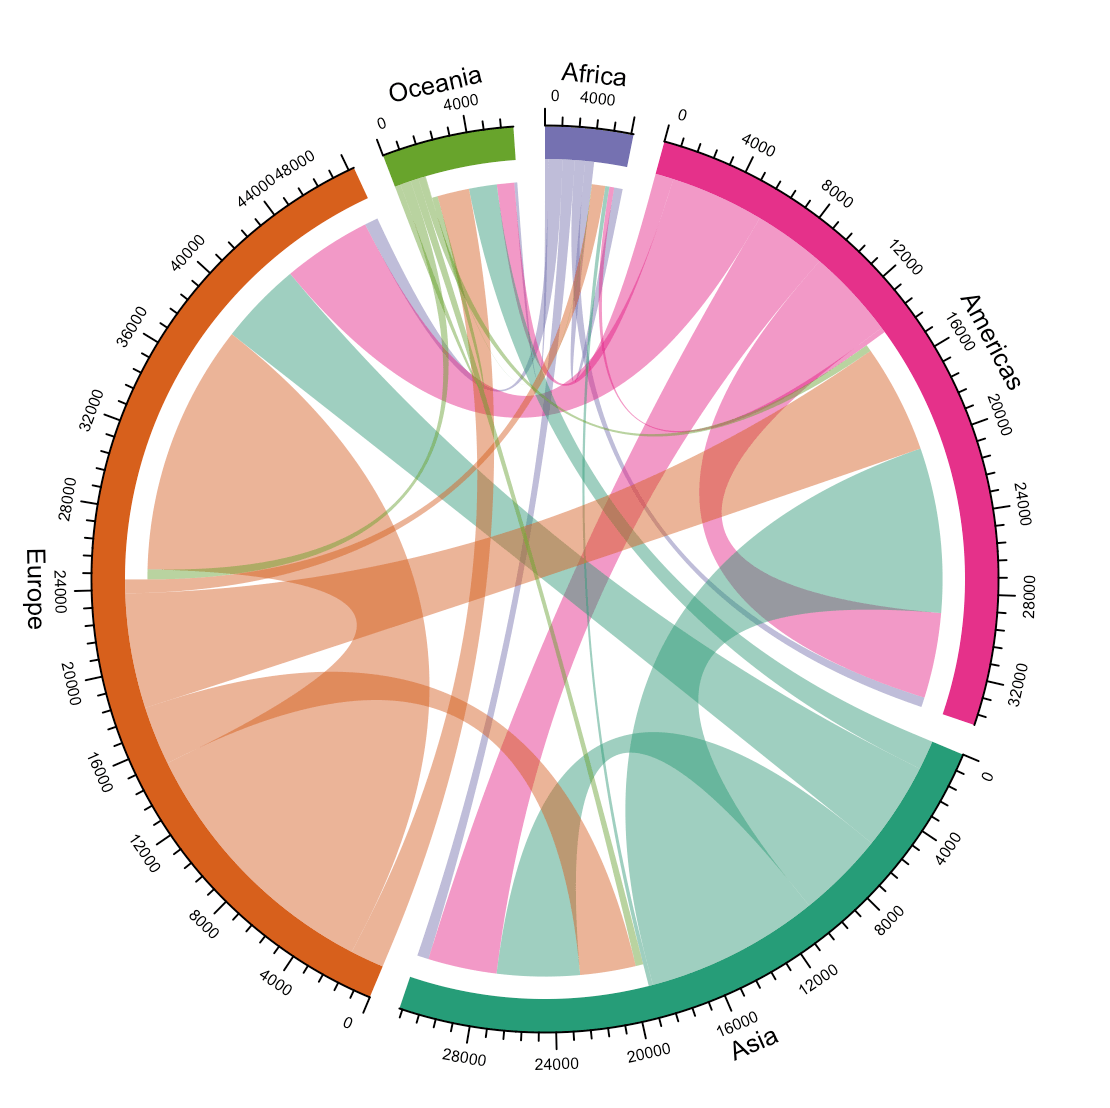
The Flux of Academic Migration
(Made in R, 2017)
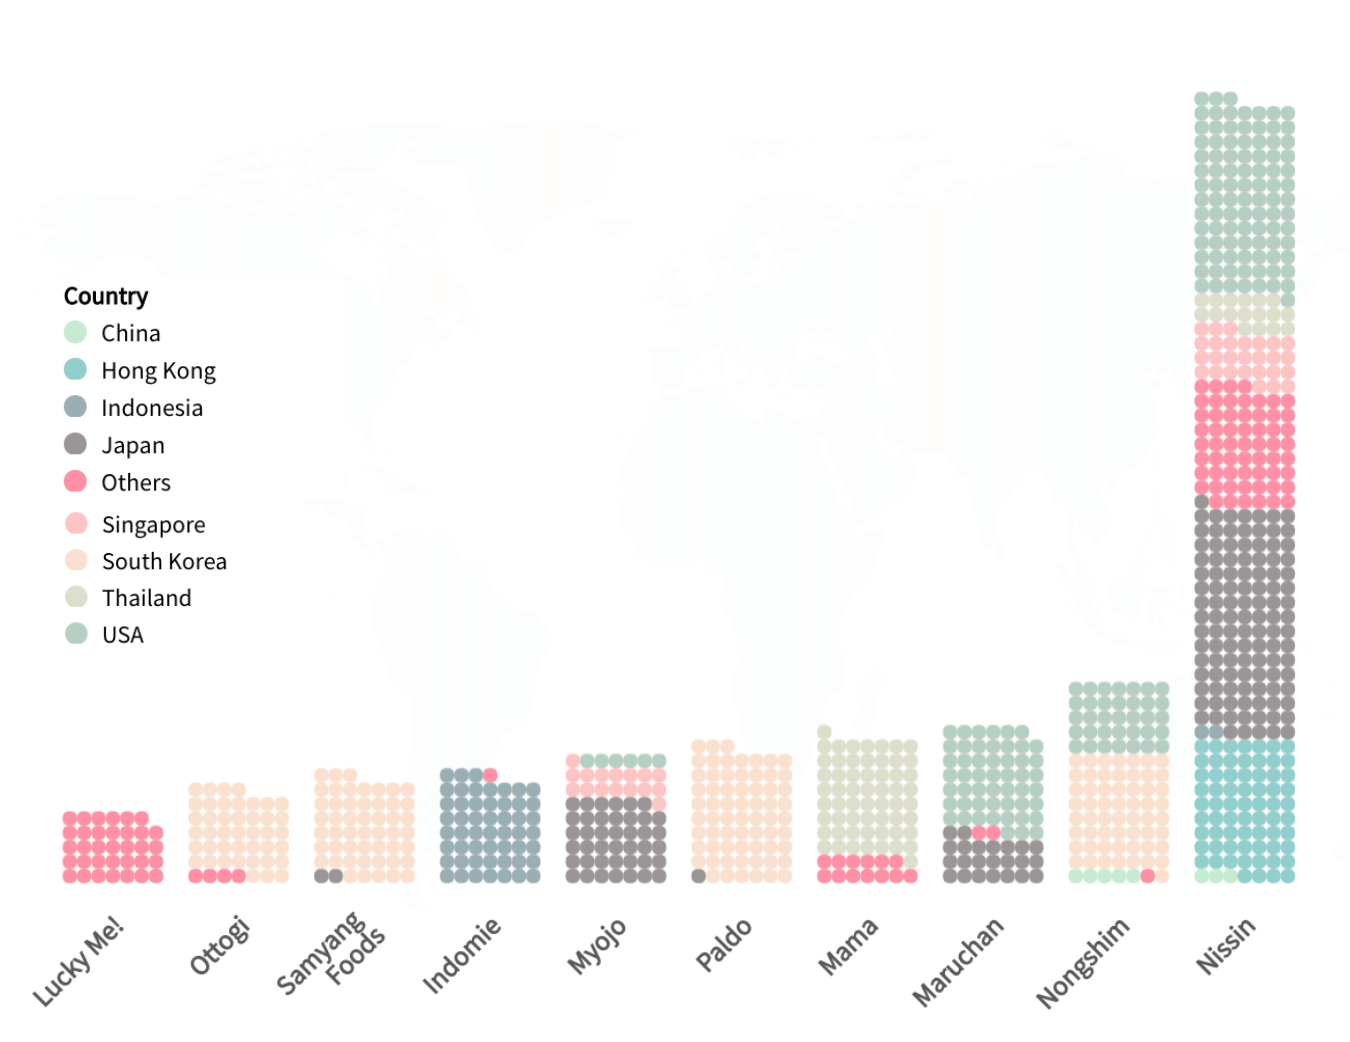
The Secret Life of Instant Noodles
(Made in Flourish, 2018)
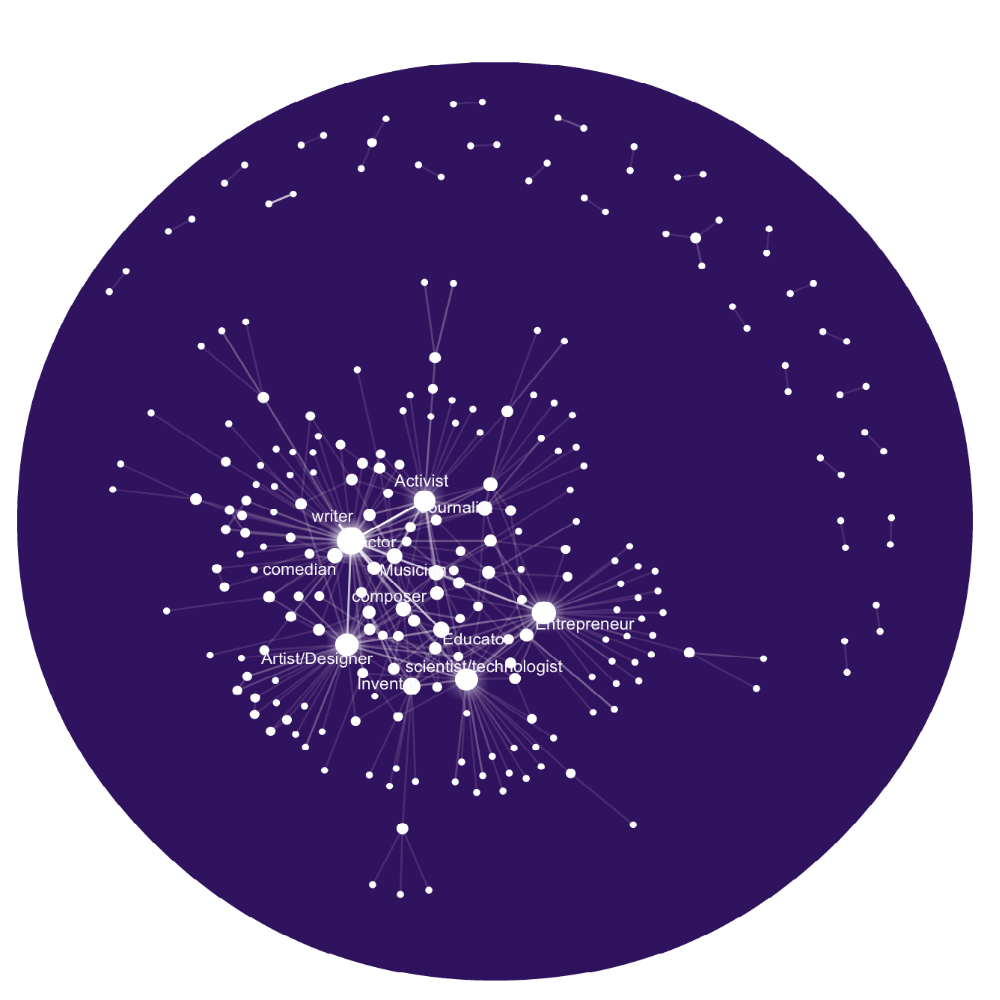
Visualizing historical influencers
(Made in Tableau, 2018)
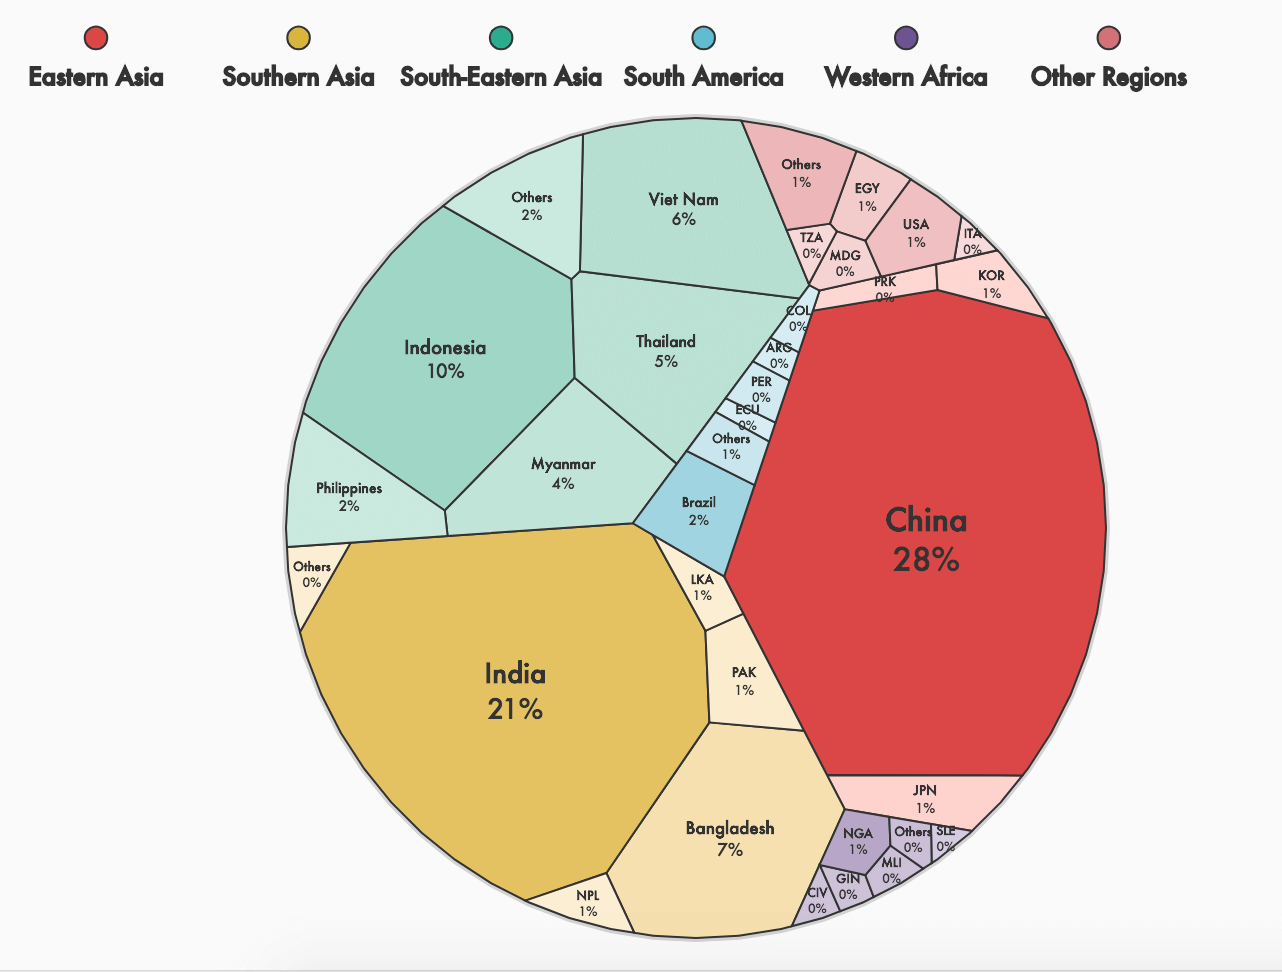
Where does rice come from
(Made in D3.js, 2018)
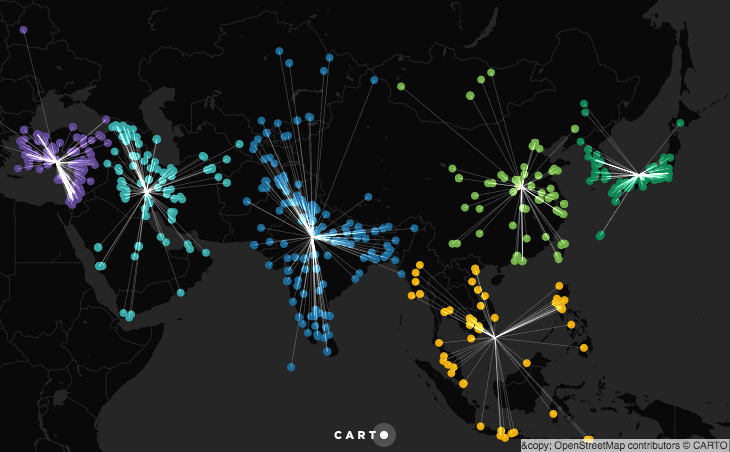
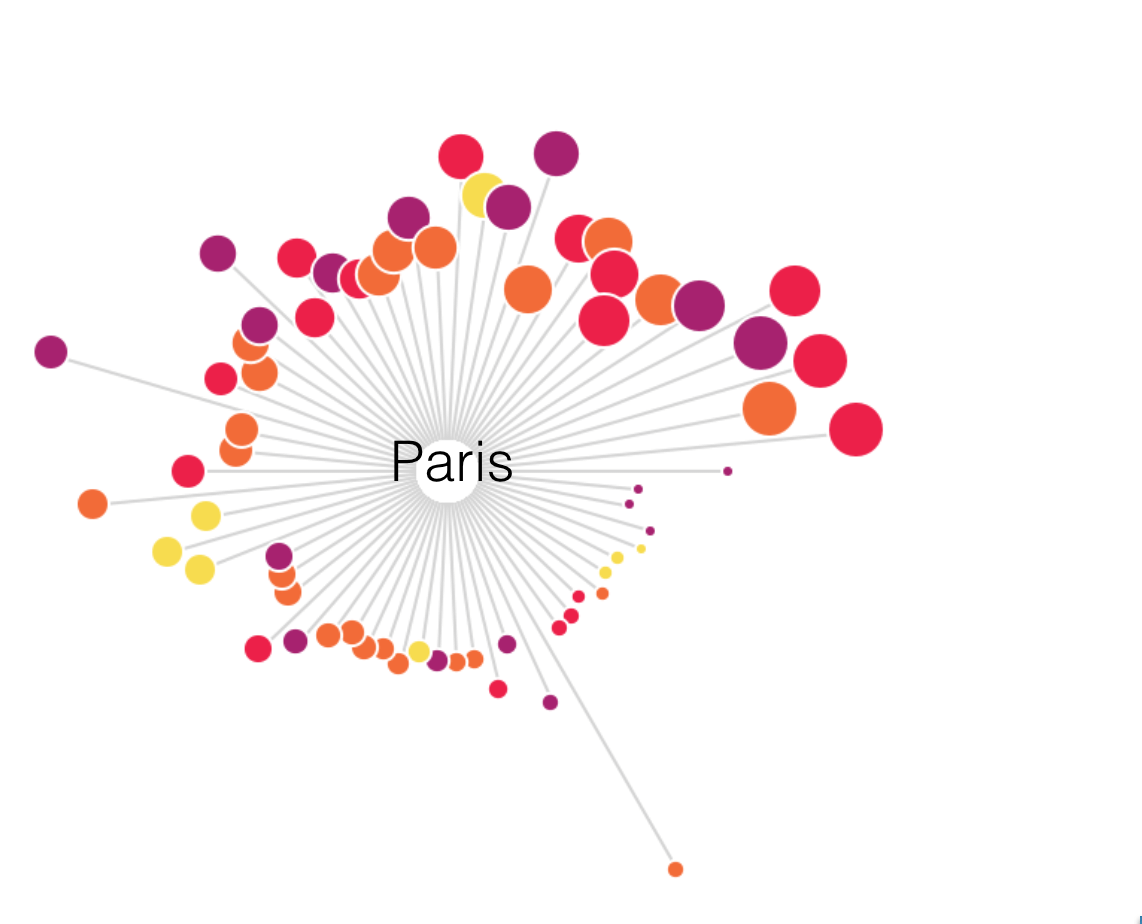
In Search of Cultural Capitals
(Made in Carto, 2018)

Where to View Cherry Blossom
(Made in Tableau, 2018)
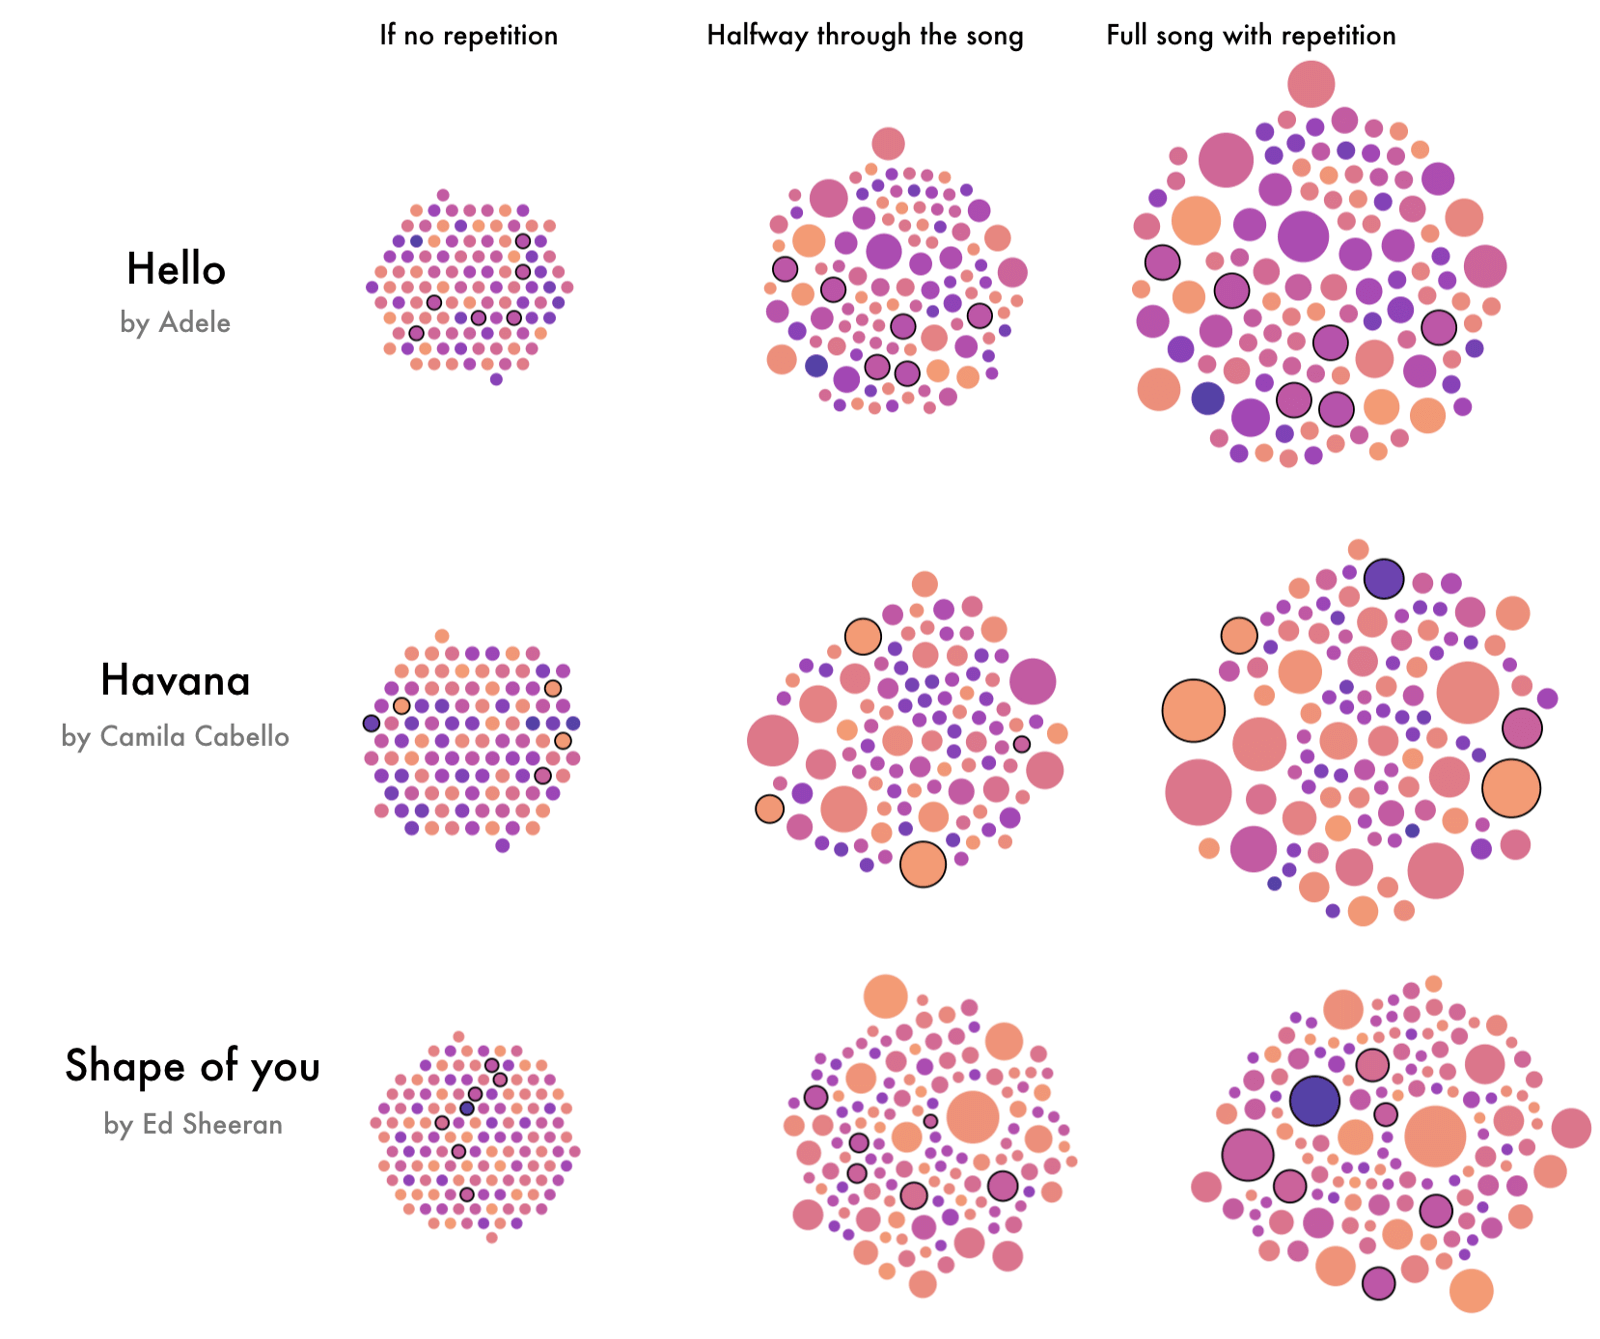
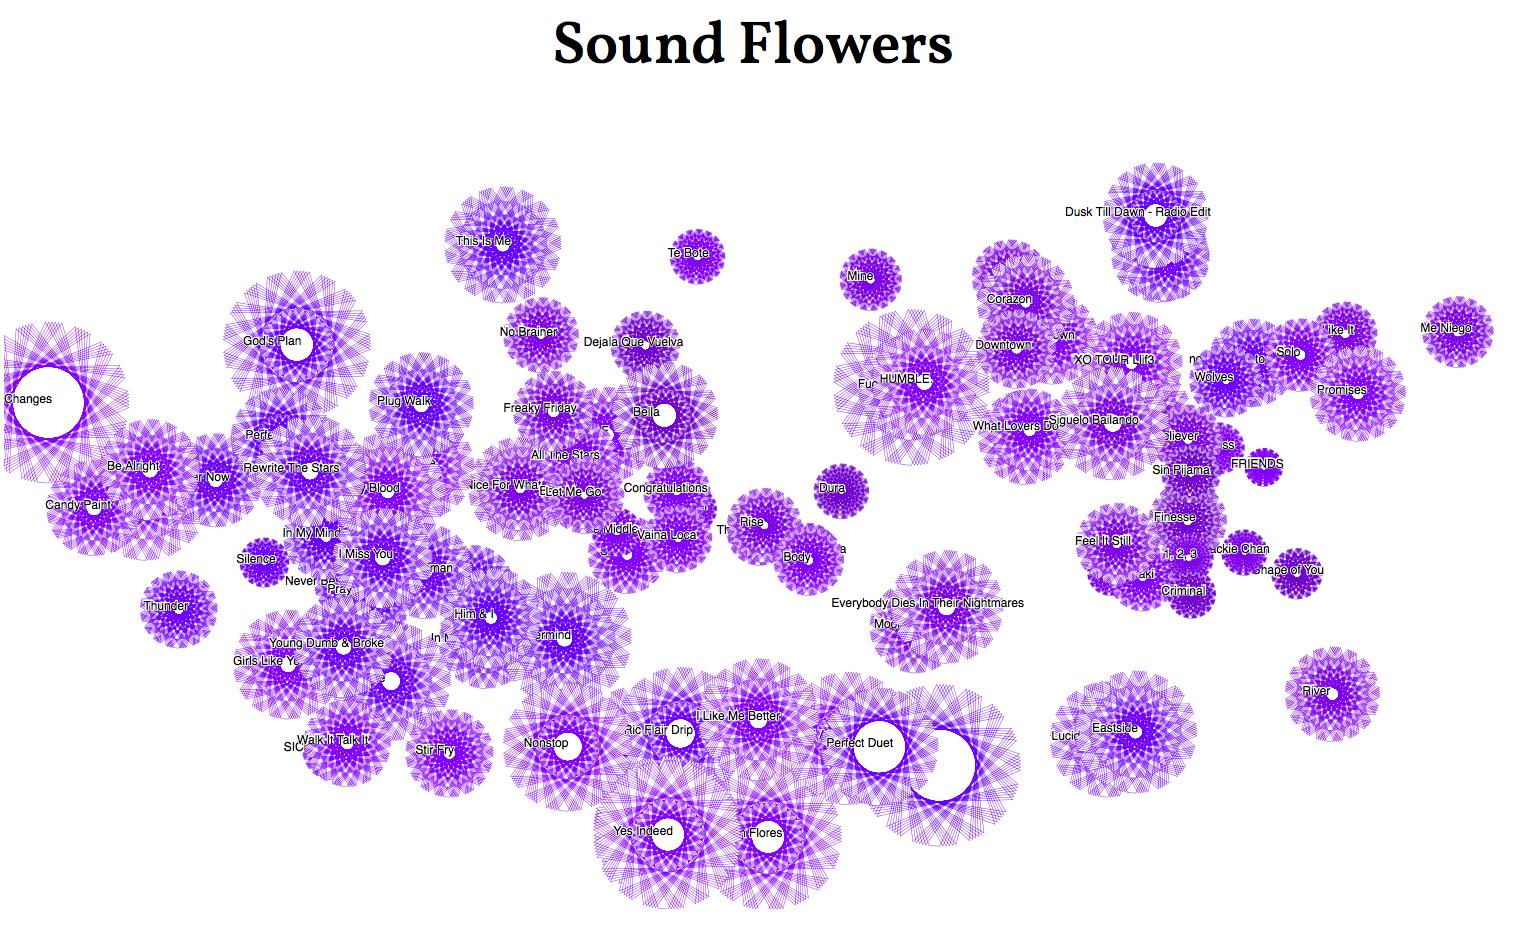
A Microscopic View of Lyric Repetitiveness
(Made in R, 2018)
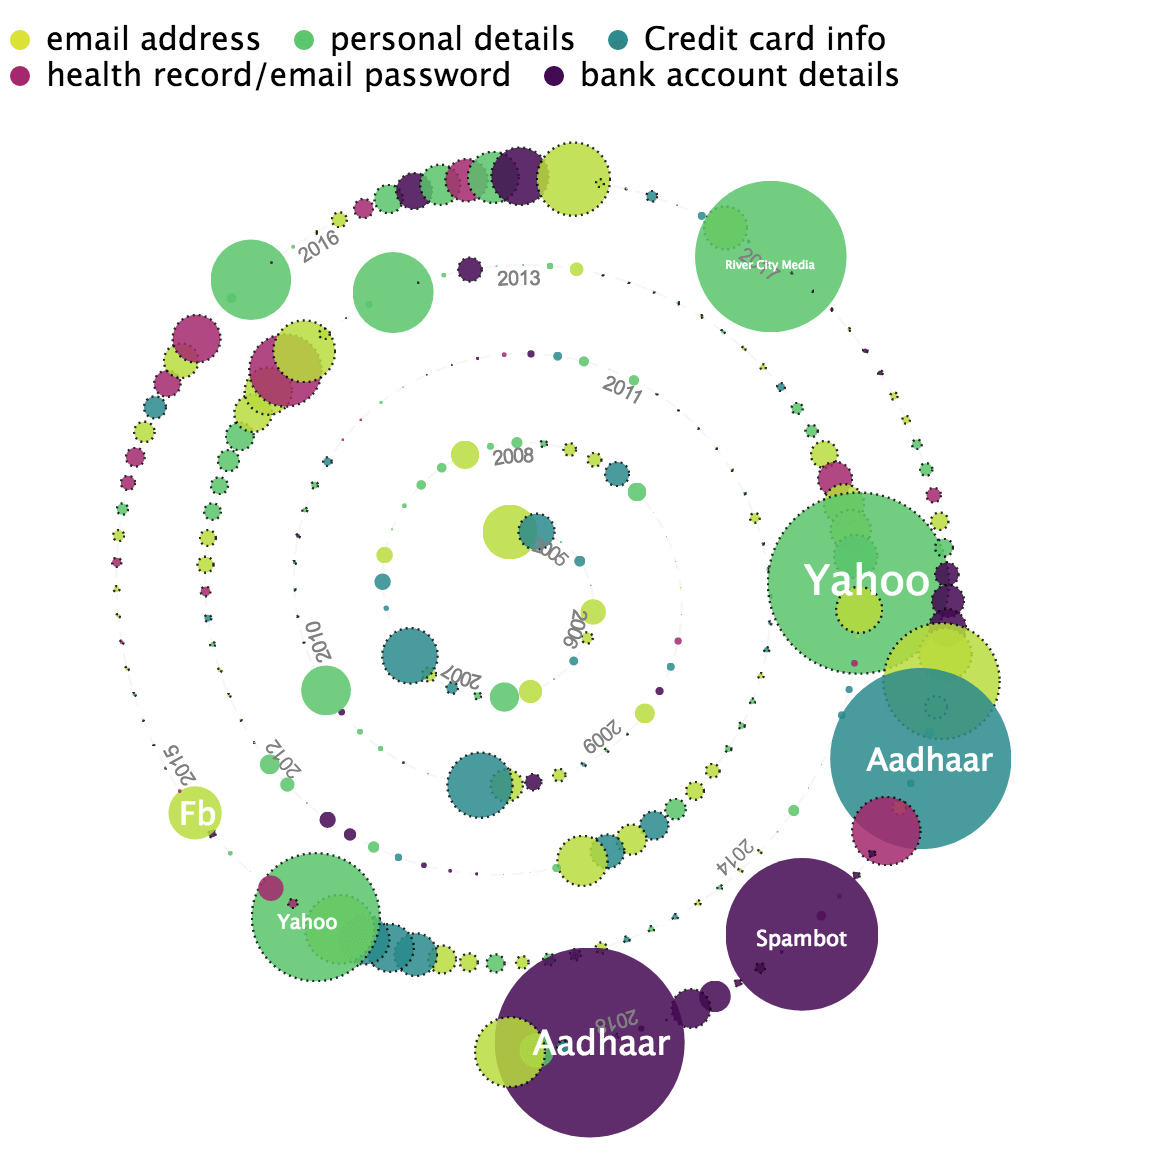
Has Data Breaches Spiraled out of Control
(Made in D3.js, 2018)
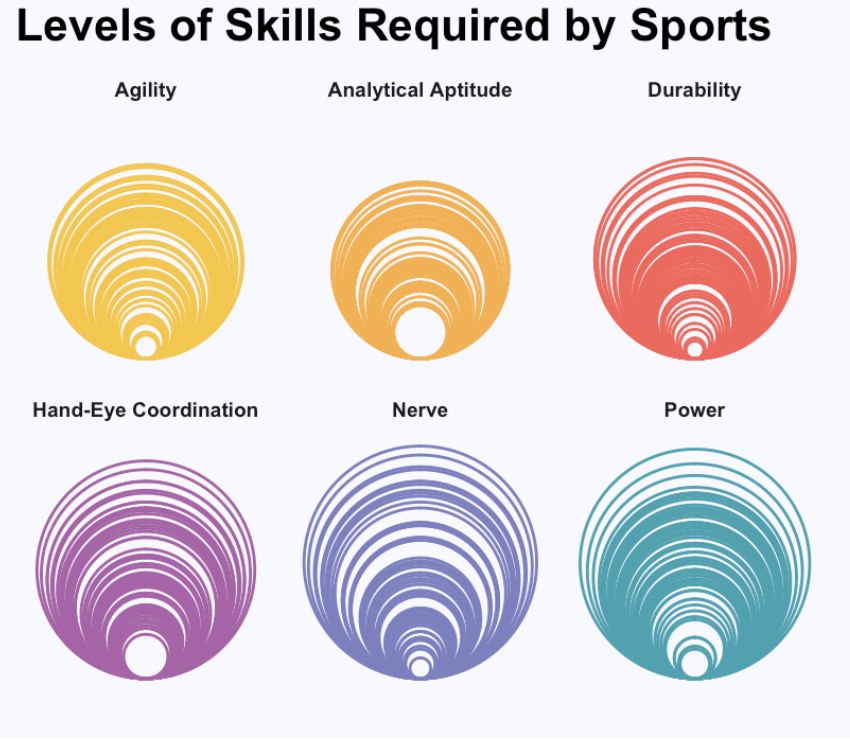
Which Sport is the Toughest of Them All
(Made in R, 2018)

(Made in p5.js, 2019)
(Made in p5.js, 2019)
(Made in p5.js, 2019)
(Made in p5.js, 2019)
(Made in p5.js, 2019)
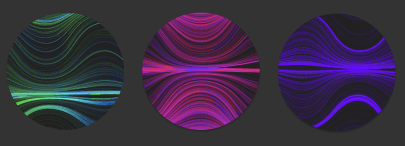
Flow fields
(Made in p5.js, 2020)
(Made in R, 2020)
(Made in Processing, 2021)
(Made in p5.js, 2021)
(Made in p5.js, 2021)
(Made in R, 2021)
(Made in D3.js, 2021)
(Made in p5.js, 2021)
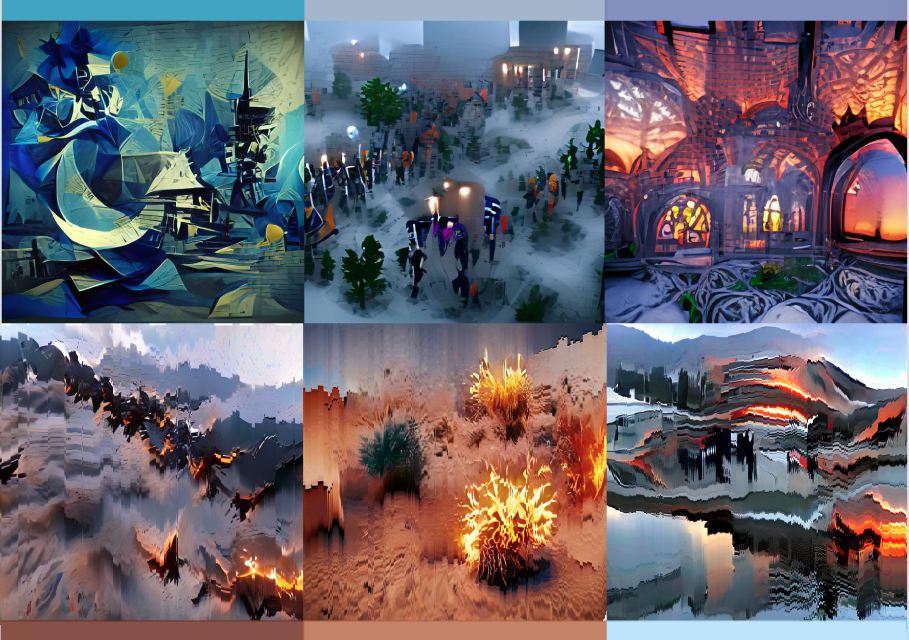
(Made in python with VQGAN+CLIP, 2021)
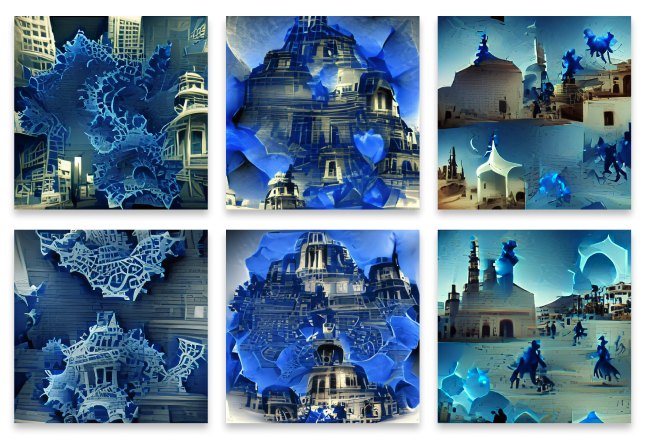
(Made in python with VQGAN+CLIP, 2021)
(Made in python, 2021)
(Made in p5.js, 2021)
(Made in p5.js, 2021)
(Made in p5.js, 2021)
(Made in p5.js, 2021)
(Made in p5.js, 2021)
(Made in p5.js, 2021)
(Made in p5.js, 2021)
(Made in p5.js, 2022)
(Made in p5.js, 2022)
Totem of Taste
(Made in P5.js, 2022)
Mirage
(Made in P5.js, 2022)